Chapter 3 ~ How the Internet and IoT Work
⬆ Shiftrefresh Shift-Refresh this page to see the most up-to-date instructions.
This page will load slowly because it is serving several movies.
← This Week's Objectives, listed at the left, walk you through the steps to visualize how the internet works. You'll draw its major components with vector tools, add it to a poster, add a background photo, and explain the parts in more detail.
For discussion, you'll sketch a diagram of a Bluetooth or other proximity/personal network device that you use and explain how it works. You'll take, edit, and upload a photo of the diagram into a Canvas discussion thread and add your notes. Then, you'll reply to at least one classmate with more research about their topic.
This chapter's skills and discussion will take between 4 and 12 hours to complete.
The World Wide Web will be 30 years old in 2023! When introduced by Tim-Berners Lee of Great Britain, it disrupted societies around the world— positively and negatively— and we'll never be the same. It has enabled people around the globe to have their own voice in words and pictures, build online communities to support many aspects of their lives, navigate the vast array of information and locations, and ensure they are ready for the future— all from a handheld device called a cellphone.
Other technologies, such as appliances, autos, and equipment enjoy improvements (and sometimes problems) associated with their connection to the internet. The privacy, security, and ultimately our safety depends on using these powerful tools with integrity and Threat Intelligence (which we'll learn more about in Chapter 5).
3.1 Diagram how the internet works using vector tools.

If you've manipulated photos on your phone (or "Photoshopped" a photo), then you were manipulating pixels in a red, green, and blue (RGB) environment (where mixing the three colors of light makes white). Those photographs (pixels in varying tints and shades of millions of colors combine together to make an image) can get blurry (or pixilated) when they are compressed so that they can load very quickly for display on a web page.

An alternative to pixel-based imagery is vector-drawn imagery, where the images are derived with mathematical Bézier curves. These 'line art' drawings scale to larger or smaller drawings without losing their clarity. We'll use this method of image creation in this lesson.
Diagramming skills are often needed in the workplace to illustrate a concept, product, or service, diagram an organizational system, or demonstrate a procedure.
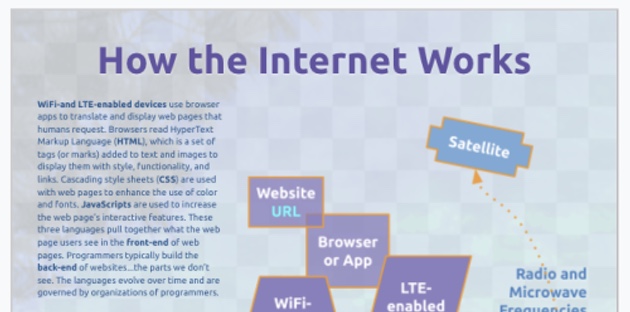
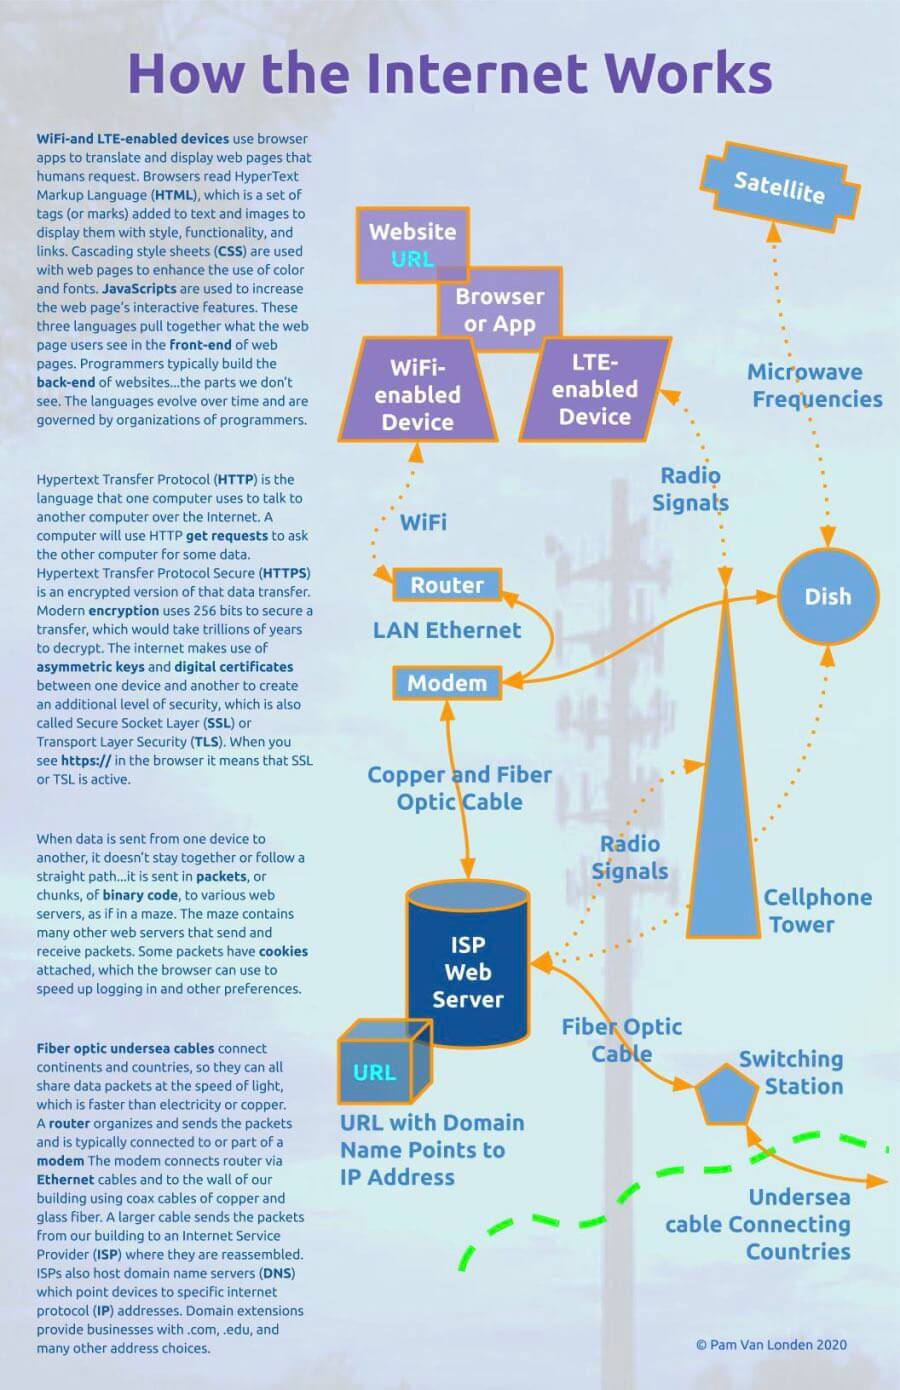
In this lesson, you will draw a rudimentary diagram which illustrates how the internet works. Using simple rectangles, circles, and triangles, and various lines, you'll show how a website in a browser on an electronic device has an address which points to a specific block of a web server, which is accessed via fiber optic, cellular, and satellite technologies. You'll label each item and show which way the transfer of data is moving.
Then, you'll add the finished diagram to a poster-sized digital canvas to explain the components and experiment with photo manipulation and page layout.
3.1.1 Set up a Google Drawing file.
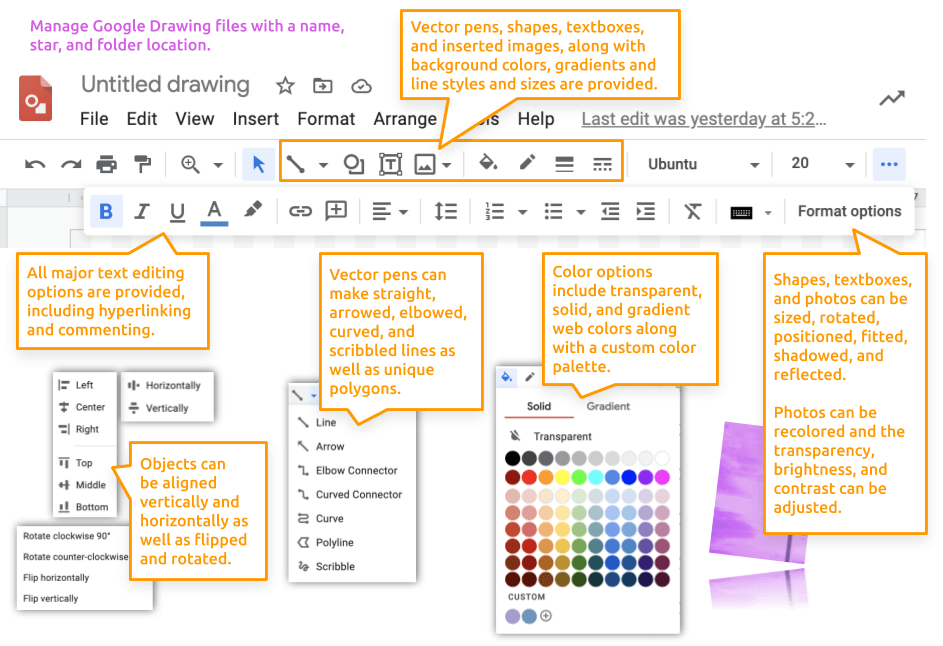
Google's Drawings app provides all the typical 2-dimensional vector drawing tools found in applications like Adobe Illustrator, CorelDraw, and Affinity Designer. It works well for projects that require just one page of imagery, such as a logo, diagram, or poster. It includes rudimentary Bézier curve pens, photo enhancing adjustments, and typography options.
Learn more about the Google Drawings user interface:
- Navigate to your OSU Google Account's Drawing application.
You can launch the application by clicking the link in the previous sentence, or by typing https://docs.google.com/drawings/ into the search bar.
This assignment works best when using the Chrome browser.
Alexander Robertson demonstrates setting up a Google Drawings file. (2023) - Rename the blank Google Drawing file as ch3-internet-diagram-username.
Replace -username with your ONID username.

- Use the folderfolder icon at the right of the file name to move the file to your CS 101 folder.
- > to customize the default page size from 10 by 7.5 inches to 7 by 14 inches.
 →
→

If you use Chrome browser on Windows, you may not have the option of changing the page setup size, which is fine. - Click OK
- Use the magnifying glass icon to zoom into the top of the canvas at 100%.
3.1.2 Draw shapes and text on the canvas.
Notice that the blank file has a checkerboard pattern on it. This is referred to as the 'canvas'. The checkerboard represents a transparent surface.
- Select the toolbar's > Shapes > Rectangle tool.

- On the top left quadrant of the canvas, click and drag the rectangle tool.
Unclick when you have made a shape that is roughly
an inch tall and wide, like this:

Click to select the shape. Changes to the shape's properties will only happen when the shape is selected. You'll know it is selected when you see the little square handles on the corners and sides. Use those handles to stretch the shape. Use the top handle to rotate a shape. - Double-click in the middle of the shape to edit the text. Type Website URL.
- From the Toolbar, change the background fill color to Light Purple 1.
Then, click the Custom option on the color palette to locate the transparency slider.
Slide it so it is one-third of the way from the right to reduce its opacity (making it slightly transparent).

- Change the border weight and border size to 4px orange,
and text font, size, and color to Ubuntu Bold 20pt white,
and align them in the center middle, like this:


If the Ubuntu Bold font is not listed in the dropdown fonts menu, then click on menu to locate it from the longer list. - From the Toolbar, change the URL text to bold cyan. The URL is the focus of the diagram, so highlighting it with a brighter color will help our eyes track its path.
- Ctrlc or ⌘c to copy the rectangle, then Ctrlv or ⌘v to paste it 1 time.
- Move the new rectangle so you can edit the text.
Update the name by double-clicking on the shape.
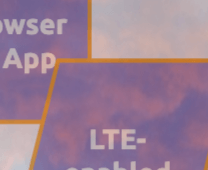
Label the second shape as Browser or app.

- Adjust the rectangle sizes to fit the text. Overlap the two shapes to show they are related.
- Click and drag the parallelogram tool onto the canvas. Unclick when you have made a shape that is roughly an inch tall and wide. Double-click into the shape to label it LTE-enabled Device. Color the background Light Purple 1 (solid; not transparent), the line in 4px solid orange, and the text in Ubuntu Bold 20pt white aligned to the center and middle.
- Click and drag the trapezoid tool onto the canvas.
Unclick when you have made a shape that is roughly an inch tall and wide.
Double-click into the shape to label it WiFi-enabled Device.
Color the background Light Purple 1,
the line in 4px solid orange, and
the text in Ubuntu Bold 20pt white aligned to the center and middle.

- Using either the > > Bring to the front menu,
the ,
or CntlShift↑,
order the shapes so that the Website URL and Browser or App shapes
are under the WiFi and LTE shapes, like this:

- Ctrlc or ⌘c to copy one of the rectangles, then Ctrlv or ⌘v to paste it 2 times.
- Select both by dragging the cursor over both of them,
or Shiftclicking on each.
These rectangles represent the technologies that allow your devices to connect to the internet inside a building.
From the Toolbar, change the background of both to Light Blue 1 and the line to 4px solid orange.
Label the first shape as Router and the second shape as Modem
in Ubuntu Bold 20pt white aligned to the center and middle.
Arrange the two rectangles below of the first set of purple shapes, with the Router
on top and the Modem on the bottom, like this:

- Click and drag the circle tool onto the canvas with the Shift key pressed.
Unclick when you have made a shape that is roughly
half-an-inch square, like this:

This shape represents a satellite dish. From the Toolbar, change the background color to Light Blue 1 and the line to 4px solid orange. Move the circle to the middle right edge of the canvas. Double-click on the shape to change the label to Dish in Ubuntu Bold 20pt white aligned to the center and middle. - Click and drag the cross shape on the canvas.
Unclick when you have made a shape that is roughly
one-and-a-half inches wide and half-an-inch tall, like this:

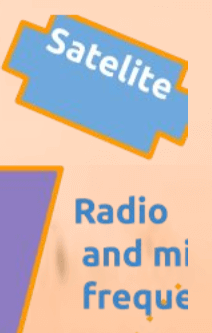
This shape represents an orbiting satellite craft. Click on the rotating handle at the top and tilt the shape to the right a bit so it appears to be orbiting everything below it. Click to select the shape and change the background color to Light Blue 1 and the line to 4px solid Orange. Move the cross so it sits snugly in the top middle edge of the canvas. Be sure the orange lines do not spill over the canvas, or they will get cut off when saving the file later. Double-click in the shape to change the label to Satellite in Ubuntu Bold 20pt White aligned to the Center and Middle. - Click and drag the pentagon shape on the canvas.
Unclick when you have made a shape that is roughly
half-an-inch wide and tall, like this:

This shape represents the building that receives the undersea cable and switches it to the local cable network. Click to select the shape and change the background color to Light Blue 1 and the line to 4px solid orange. Move the pentagon so it sits below dish circle. Since the shape is too small to allow more than one character of text, click and drag the Textbox tool beside it. Click into the textbox and type Switching Station. Select all Ctrla or ⌘a the text and change it to Ubuntu Bold 20pt Dark Blue 1. - Click and drag the equilateral triangle tool on the canvas.
Unclick when you have made a shape that is roughly
half-an-inch wide and an 3 inches tall, like this:

This shape represents a cellphone tower. From the Toolbar, change the background color to Light Blue 1 and the line to 4px solid orange. Move the triangle so it sits just left of the Dish circle. Leave lots of room between these shapes. Since the shape is too thin to allow more than one character of text, copy the dark blue Switching label and paste it beside the triangle. Change the text to Cellphone Tower - Click and drag the can tool on the canvas.
Let go of the click when you have made a shape that is roughly
1 inch wide by 2 inches tall, like this:

This shape represents a web server computer provided by an Internet Service Provider (ISP).
Click to select the shape and change the background color to Dark Blue 2, the line to 4px solid orange, and the text in Ubuntu Bold 20pt white aligned to the center and middle. Move the can so it sits under the Modem rectangle. Click into the shape and type ISP Web Server. - Click and drag the cube tool on the canvas.
Let go of the click when you have made a shape that is roughly
half an inch square, like this:

This shape represents the portion of the web server that hosts the website which points to the Internet Protocol number and Domain Name of the URL requested by a website (like in the first rectangle you made earlier). Click into the shape and type URL.
From the Toolbar, change the background fill color to a customized transparent version of Dark Blue 2, the line to 4px orange, and the text to Ubuntu Bold 20pt cyan (to match the other URL label's color) aligned to the center and middle. Move the cube so it sits on top of the web server can's bottom left corner, like this:
Ctrlc or ⌘c one of the other blue textboxes, then Ctrlv or ⌘v paste it. Move it under the Can. Click into the textbox and type URL with domain name points to IP address.
3.1.3 Draw lines and text on the canvas.
- Click and drag the curved connector line tool on the canvas.
Unclick when you have made a line that is roughly an inch wide. You will stretch is as needed later.

This line represents Wireless Fidelity (wifi) radio frequency signals. From the Toolbar, change the line to 4px dotted orange and each end to an arrow.
Move the left endpoint/arrow to touch the bottom side connection dot of the Wifi trapezoid. Move the right endpoint/arrow to touch the left side connection dot of the Router rectangle.
With the line end-points snapped to the shapes' connection dots, the lines should move along with the shapes when rearranging them.
- Select, Ctrlc or ⌘c to copy the existing Cellphone Tower label, then Ctrlv or ⌘v to paste it onto the canvas. Move it to just above the new wifi line. Change the label to Wifi.
- Select, Ctrlc or ⌘c to copy the existing Wifi connector line and its label,
then Ctrlv or ⌘v to paste them onto the canvas.
Update the label text and arrow connections using the same procedure as the previous step for these shapes:
- The right side of the LTE-enabled device parallelogram to the top of the Cellphone Tower triangle. Change the label to read Radio Signals.
- The left side of the Cellphone Tower triangle to the right side of the ISP can. Change the label to read Radio Signals.
- The right side of the ISP can to the bottom of the Dish circle. This line may not have room for a label; it can share the previous Radio Signals label.
- The bottom of the Satellite cross to the top of the Dish circle. Change the label to read Microwave Frequencies.
- Select, Ctrlc or ⌘c to copy one of the existing connector lines and its label.
Change the line's style from dotted to solid.
Ctrlc or ⌘c to copy the solid line,
then
Ctrlv or ⌘v to paste it onto the canvas 5 times.
Do the same for 5 new labels.
Update the label text and arrow connections for the remaining shapes, so they look like this:
 :
:
- The bottom side of the Router rectangle to the top of the Modem rectangle. Change the text to read LAN Ethernet, which refers to a Local Area Network (LAN).
- The bottom side of the Modem rectangle to the top of the ISP can. Change the text to read Copper and Fiber Optic Cable.
- The right side of the Modem rectangle to the left side of the Dish circle. This connection can share the previous Copper and Fiber Optic Cable label.
- The top of the ISP can to the bottom of the Dish circle. This connection can share the previous Radio Signals label.
- The right side of the ISP can to the left side of the Switch pentagon. Change the text to read Fiber Optic Cable.
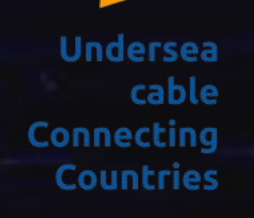
- The right of the Switch pentagon to the right edge of the canvas. Change the text to read Undersea cable connecting countries. Update the alignment to fit well with the shape and line.
- Use the Toolbar's > Scribble tool to draw a wavy diagonal line from the
right side of the canvas to the bottom side to represent the seashore...where land meets the sea.
Change it's thickness to 8px, the color to green and style to dashed, like this:

3.1.4 Doesn't your diagram look great!
When you are finished, the canvas should include all of these components with their corresponding colors, sizes, fonts, and styles
arranged, so they are legible and clear:
- Shape sizes are adjusted to fit their labels, so they are not too big or too small.
- Textboxes are typically centered, but can be aligned right or left to improve clarity.
- Shapes are Light Purple 1, Light Blue 1, or Dark Blue 2 with 4px Orange outlines. Specific shapes are transparent.
- Fonts are 20pt Bold Ubuntu in White (inside shapes) and Dark Blue 1 (textboxes).
- URL font is Bold Cyan.
- Signal connector lines are 4px Dotted Orange and Cable connector lines are 4px solid Orange.
- Shoreline is 8px Dashed Green.
3.1.5 Output the drawing file.
The drawing file has been automatically saving itself to your Google drive.
- To ensure it is saved in a folder for this course, click the folder icon next to the file name. Change its location to a folder called CS 101 on your Google Drive.
- In addition to this working file, you'll want to save it as a PNG file, so we can add it to other files, and specifically, to the poster we'll make later. Choose > PNG file. Move the downloaded .PNG file to your local hard drive, such as C: drive's > CS 101 folder.
- If you double-click on the .PNG file from your hard drive, or view it in the browser, it may display with a black background, which means it is transparent, as it should be.
3.2 Synthesize internet components.
- Using the Code.org and other movies below, learn the basics of each component of the vector diagram you made earlier.
Synthesize
the content, rather than simply
summarize
the content using your notes application or word processor.
Synthesis writing will prepare you for future required
BACC courses.
Using either your notes application or word processor, write roughly 50 words for each of the 5 major component groups listed below:
Synthesize each of these key concepts related to how the Internet works:- Undersea Cables, Fiber Optic and Copper Cables, and Radio waves.
- Packets and Routers.
- Internet protocol HTTP, HTTPS, SSL, and TLS.
- Domain Name Servers and Web Servers.
- Hypertext Markup Language (HTML), Cascading Stylesheets (CSS), JavaScript, and Browsers.
What is the Internet and how does it work? ~ 3:44 The Internet: Wires, Cables, and Wifi ~ 6:40 The Internet: IP Addresses and DNS ~ 6:44 The Internet: Packets, Routing, and Reliability ~ 6:26 The Internet: HTTP and HTML ~ 7:06 HTML, CSS, JavaScript Explained ~ 4:00 The Internet: Encryption & Public Keys ~ 6:40 - Check and correct grammar and spelling using the built-in functions, and, if possible, one of these extensions:
Grammarly plugin,
or LanguageTool Chrome extension.
- Click the Review tab on the ribbon. Click Spelling or Spelling & Grammar.
- Click Tools > Check Spelling > Spell check. A box will open in the top right corner.
- ⌘; or choose Edit > Spelling and Grammar > Check Grammar With Spelling (a checkmark indicates it’s on), then choose Check Document Now.
- No bibliography entries are needed for this assignment.
3.3 Combine the diagram and writing into a poster.
This lesson will help you gain experience creating infographics/posters with diagrams, text, and photos.
Be creative by choosing a different photo, a different color scheme, and a different font than the examples.
3.3.1 Design the poster.
Navigate back to your OSU Google Account's Drawing application.
- Rename the blank Google Drawing file as ch3-how-internet-works-poster-username.
Replace -username with your ONID username.

- Use the folderfolder icon at the right of the file name to move the file to your CS 101 folder.
- > to customize the default page size from 10 by 7.5 inches to 11 by 17 inches. Click OK
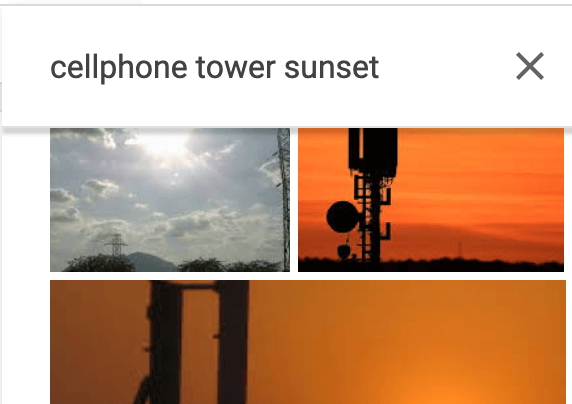
- Insert a photo from a web search using > Image > Search.
Search one or more of these phrases to locate a simple (not busy) but dramatic image:
- "undersea internet cable switching station"
- "cellphone towers at sunset"
- "satellite in the sky"
- "page of html code"
- ...or any other combination of keywords from this chapter.
- View > Zoom out 2 or 3 times to see just a thumbnail size of the canvas.
- Stretch the photo to fit the canvas without distorting it:
- If the top and bottom edges of the photo and canvas are lined up but the right and left edges are overhanging it...
- If the right and left edges of the photo and canvas are lined up but the top and bottom edges are overhanging it...
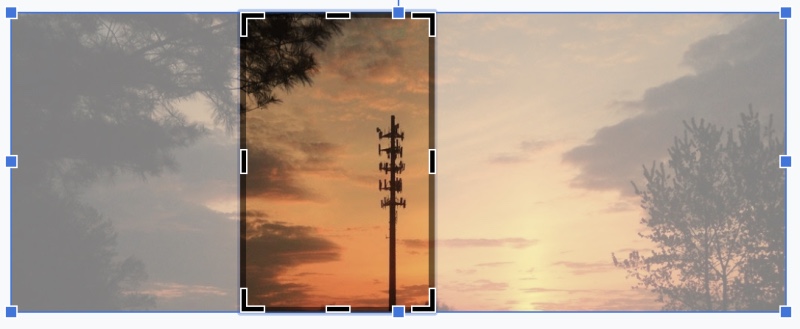
- Drag the handles as needed to fit the photo to the edges on all four sides.
- Drag the inside of the cropping box to position the photo in the most pleasing orientation; one that leaves room for the diagram and new text boxes.
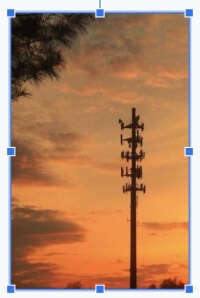
- Press Enter to save the fitted photo.
This becomes the poster background.
 →
→

- With the photo selected, use the pane to lighten, brighten, and/or colorize
the photo so that the diagram and text will be highly legible on top of it.
Expect to adjust the photo format again after you've added the heading, text, and diagram. Legibility will be evaluated. - Using the skills you learned previously, place a new textbox on the canvas and type
How the Internet Works in it.
Apply size 50pt or more (probably no more than 80pt).
Move this heading to the most logical place at the top of the canvas.
Choose a font, style, and color to ensure maximum readability.
- Insert the PNG version the diagram you created earlier and place it on the right or left side of the canvas under the heading.

Do not stretch the diagram to fit...leave it at the original proportions. You may reduce the size later to fit text as needed. - Add a new textbox and paste in the Undersea Cables, Fiber Optic and Copper Cables, Radio Waves, and Microwaves paragraph you wrote earlier.
Select the text and apply font size 12pt (or as large at 14pt).
Update the font, font color, border, border size, and background color to ensure maximum readability.
Bold key concepts.
Move the box to a logical location, such as near the undersea cable at the bottom of the diagram.
Do the same for the remaining topics:- Packets and Routers.
- Internet Protocols HTTP, HTTPS, SSL, and TLS.
- Domain Name Servers Web Servers.
- Hypertext Markup Language (HTML), Cascading Stylesheets (CSS), JavaScript, and Browsers.
- Add a copyright statement in size 12pt to the poster at the bottom under the diagram and last paragraph. Insert the copyright symbol © or type it using Alt0169 or Optiong. Add a space then the current year. Add a space then your first and last name. The statement will look like this: © 2021 Pam Van Londen, but with your name and the current year.
3.3.2 Doesn't your poster look great!
Your poster should include a colorized and fitted background photo related to the internet, a large, colorful heading, the diagram in its original orientation and proportions, and a few paragraphs that explain the components of the internet. Key concepts are bolded. A copyright statement at the bottom.
Legibility is key. Here are examples of illegibility.
Hover over the images to read why they are illegible:
3.3.3 Output the poster.
From the File menu, choose Download as PDF.
Move the PDF file to the CS 101 folder in your hard drive's Documents folder as well as copy it to the CS 101 folder on any of your cloud drives.
Complete two more steps before submitting the PDF file.
3.4 Ask for help.
Stuck on a specific step? Share your file with the instructor.
In order for the instructor and TAs to see your progress without having to download or ask for account permission, provide a correctly-set sharing URL so they can look at it live. Follow the most appropriate instructions below.
Paste the sharing URL into the Canvas Inbox message or Assignment Comment box, along with your questions. Note which step number you're stuck on.
Share Microsoft Office files from the OSU OneDrive cloud drive and share Google Suite files from the OSU Google cloud drive:
- Windows or Microsoft Account
- Login to your OSU OneDrive account from the browser.
- Drag the file from your hard drive to the OSU OneDrive file list in the browser to transfer it there.
- Beside the file name in the list, click the
 Share icon:
- Choose the settings provided in the screenshot below:

- Copy the link so you can provide it to the instructor or in the Assignment Comment box.


- Google Account
- With your file open, click the Sharing button at the top right of the screen. Or, if the file is not open but listed in the Drive, right-click it to choose the Share menu.
- Click the Get Link box to update the OSU Settings and copy the link:

- Ignore the Share with People and Groups box for this course.

Paste the URL into the Canvas Inbox message or Assignment Comment box, along with your questions. Note which step number you're stuck on.
3.5 Verify your work.
From the Canvas Home tab, click the Ch 3 ~ How the Internet and IoT Work assignment. Scroll to the bottom to see the Rubric. Compare your work to the Rubric to ensure you've included all paragraphs and materials. The rubric is based on the following scoring criteria, which are based on the instructions above: Check off each criterion to confirm you've completed them before submitting the file.
- Poster was submitted as a PDF file.
- Poster is free of plagiarism.
- Poster background photo covers the entire canvas.
- Poster font, styles, colors, and sizes increase legibility or readability.
- Diagram is 7in wide and 14in tall.
- Diagram shapes and textboxes are labeled in Ubuntu font size 20pt in blue or white.
- Diagram's URL labels are the bold cyan.
- Diagram uses solid and transparent purple, blue, and dark blue colors in the shape backgrounds.
- Diagram uses 4px orange lines around each shape.
- Diagram uses 4px orange dotted and solid curved connector lines between shapes.
- Diagram uses a 8px green dashed scribble line to represent the seashore.
- Diagram's components are well organized and easy to read.
- Poster's placement of paragraphs/textboxes are in a logical order.
- Poster synthesizes facts about Undersea Cables, Fiber Optic and Copper Cables, and Radio Waves.
- Poster synthesizes facts about Packets and Routers.
- Poster synthesizes facts about Internet protocol HTTP, HTTPS, SSL, and TLS.
- Poster synthesizes facts about Domain Name Servers and Web Servers.
- Poster synthesizes facts about HTML, CSS, JavaScript, and Browsers.
- Poster includes a copyright statement at the bottom.
- Poster uses proper grammar and spelling.
3.6 Submit the file.
Each assignment must be submitted before the Due date and time as specified on the Canvas Home tab. The Available Until date and time constitutes a grace period, which can be used in an emergency, or if you are ill (it cannot be used for every assignment). Students who submit using the Available Until date may incur score reduction. Students on a DAS Flexibility Contract: there is no need to notify the instructor. All of your Available Until dates will be set to 72 hours past the Due Date, which can be used up to 3 times. Abuse of the Flexibility Contract will be reported to DAS.
- Click on the Canvas Home button and scroll down to the chapter assignment. Click the assignment link.
- Upload the PDF file. Confirm that it uploaded.
 Check the TurnItIn Report for plagiarized phrases and sentences.
Review how to use TurnItIn.
Edit or add quote marks in your original file to ensure the second draft of the file will pass the TurnItIn inspection.
Resave the PDF file.
Upload the newer version in the assignment's Submission Details screen.
Check the TurnItIn Report for plagiarized phrases and sentences.
Review how to use TurnItIn.
Edit or add quote marks in your original file to ensure the second draft of the file will pass the TurnItIn inspection.
Resave the PDF file.
Upload the newer version in the assignment's Submission Details screen.
- Within 3 days of submission, be on the lookout for Rubric feedback and Comments from the TA and Instructor.
- Ask questions about the score and feedback in the assignment's Commenting box.


 Insert Image icon on the Discussion editing toolbar.

 thumbs-up icon on your favorite submission.